


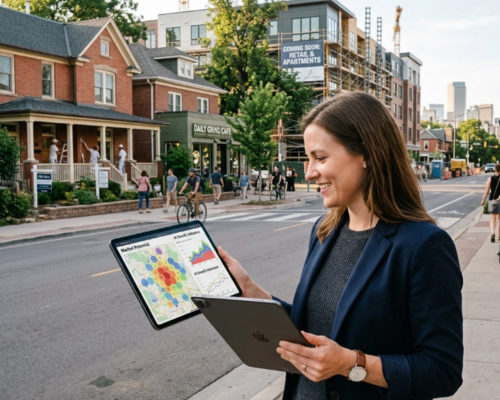
The traditional way of identifying a "hot" real estate market is fundamentally broken because it relies on looking backward. By the time a neighborhood shows up on a top-ten list or displays a surge in median home prices, the most significant gains have already been pocketed by those who moved in months or years prior. We are currently seeing a shift where artificial intelligence is moving the goalposts, allowing investors and agents to identify undervalued pockets in the Northeast and Sun Belt with a level of precision that was impossible just three years ago.
For decades, the industry relied on lagging indicators: data points like closed sales and appraisals that reflect what happened 60 to 90 days ago. Today, predictive analytics focus on leading indicators, which are the subtle breadcrumbs dropped by consumers and developers long before a deed is ever recorded. By analyzing over 500 variables in real-time, AI models are now spotting emerging trends six to twelve months before they hit the mainstream consciousness.
This technological leap is particularly relevant in 2026, as high interest rates and shifting migration patterns have made the margin for error much thinner. Whether you are looking at the inventory-constrained markets of the Northeast or the high-growth corridors of the Sun Belt, the ability to see around the corner is the only way to secure a competitive advantage in a volatile landscape.

The Shift from Lagging to Leading Indicators
The core problem with traditional real estate analysis is the "lag." If you wait for the quarterly market report to tell you that a ZIP code is appreciating, you are already competing with every other buyer who read the same report. AI changes the timeline by monitoring activity that precedes a price hike.
One of the most powerful leading indicators is foot traffic and mobility data. By analyzing anonymized mobile location data, AI platforms can detect a consistent uptick in "dwell time" in specific neighborhoods. If people are spending more time in a local park or a previously quiet retail strip, it suggests a shift in lifestyle appeal that will eventually translate into housing demand. When foot traffic increases by 15% in an undervalued area over six months, a price correction is almost always on the horizon.
Building permits and zoning applications provide another layer of foresight. In the Northeast, where regulatory hurdles are notoriously high, a sudden cluster of residential renovation permits or commercial "change of use" applications is a flare in the dark. AI algorithms scrape municipal records daily to find these clusters, identifying areas where developers are quietly placing bets before the first "Coming Soon" sign ever hits the yard.
Identifying Pockets of Value in the Sun Belt and Northeast
The Sun Belt and the Northeast represent two very different challenges for the modern investor. In the Sun Belt, the challenge is often oversupply and cooling demand in major hubs like Austin or Phoenix. In the Northeast, the challenge is chronic inventory shortages and high barriers to entry. AI is currently being used to find the "spillover" markets in both regions.
In the Sun Belt, predictive tools are looking past the major metros to identify secondary "satellite" towns. These are areas that maintain the tax benefits and climate of the major hubs but offer significantly lower entry points. By analyzing job posting data and corporate relocation announcements, AI can predict where the next wave of remote workers will land. If a major tech firm announces a regional office, AI doesn't just look at that city; it looks at every suburb within a 45-minute commute that currently has a high "quality of life" sentiment score.
In the Northeast, the focus is on "micro-gentrification." Because inventory is so tight in places like Connecticut and New Jersey, buyers are forced into adjacent neighborhoods. AI identifies these targets by monitoring online sentiment analysis. It scans social media check-ins, local reviews, and search trends to see where the "cool factor" is migrating. When the search volume for a specific neighborhood's local amenities outpaces the search volume for its real estate listings, you have found a market that is about to explode. You can find more on these regional shifts in our community guides.
The Role of Online Sentiment and Social Data
We often think of real estate as a game of numbers: square footage, cap rates, and school scores. However, real estate is driven by human emotion and social perception. AI is now capable of quantifying that perception through sentiment analysis.
Algorithms can now process millions of data points from Yelp, Instagram, and local community forums to gauge the "vibe" of a neighborhood. A sudden spike in positive mentions of a new coffee shop, a boutique fitness studio, or a community garden often correlates with an influx of higher-income residents. This "lifestyle-first" data is a remarkably accurate predictor of future property value increases.
Furthermore, search intent data is a massive tell. If Google searches for "best restaurants in [Neighborhood X]" are growing at 30% year-over-year, but the number of homes for sale in that neighborhood is staying flat, the basic laws of supply and demand dictate that prices must rise. These digital footprints allow us to spot a "hot" market while it still looks like a "sleepy" neighborhood on paper. For more insights on how these trends impact your strategy, check out our articles section.
Practical Impact for Stakeholders
The rise of predictive neighborhoods isn't just a win for institutional investors; it changes the day-to-day operations for everyone in the ecosystem.
For Investors
The primary benefit is the ability to achieve higher yields by entering markets early. Instead of bidding on properties in established "blue-chip" areas where cap rates are compressed, investors can use AI to find "path of progress" opportunities. This allows for acquisition at lower price points with a clear exit strategy based on data-backed appreciation forecasts.
For Buyers
Homebuyers can avoid the frustration of "bidding war fatigue" by looking at neighborhoods that the AI identifies as being on the cusp of growth. This allows buyers to build equity faster and secure a home in an area that will likely see improved amenities and infrastructure during their ownership period. Understanding buyer resources is key to navigating this.
For Sellers
Homeowners in these emerging areas can use this data to time their exit perfectly. If the data shows that a neighborhood is reaching its "peak sentiment" or that inventory is about to flood the market due to new developments, a seller can list their property at the moment of maximum demand.
For Realtors
Agents who leverage predictive data move from being "door openers" to "strategic advisors." By presenting clients with data that shows why a specific area is a smart long-term bet: rather than just showing them what is currently for sale: realtors can build a deeper level of trust and close deals with more confident clients. Our finance featured section often discusses how these strategies play out in the long run.

Accuracy Rates and the Human Element
It is important to address the "scary accuracy" of these tools. Current AI models for multifamily and residential rent projections in markets like Seattle and New York are hitting accuracy rates of 84% to 91%. This isn't a guess; it is a statistical probability based on massive datasets. However, while the tech is powerful, it is not infallible.
Data can sometimes miss the "boots on the ground" reality. For instance, an AI might see a surge in building permits but fail to account for a local political movement that is trying to block those developments. Or, it might see a spike in foot traffic that is actually due to temporary road construction rather than a new local attraction.
The most successful participants in the 2026 market are those using a "hybrid" approach. They use AI to narrow down the thousands of potential neighborhoods to a shortlist of three or four, and then they apply human intuition and local expertise to make the final call. This is the philosophy we advocate for at Real Estate Partners.
What to Watch: The Evolution of Hyper-Local Data
As we move toward the second half of 2026, the data sets used for predictive neighborhoods will become even more granular. We are seeing the integration of "Digital Twins": virtual replicas of entire cities that allow AI to simulate the impact of a new subway line or a massive corporate headquarters before it is even built.
Watch for the convergence of climate risk data with predictive appreciation. As buyers become more sensitive to flood zones and heat maps, AI will begin to discount neighborhoods that show "lifestyle growth" but high environmental risk. The winners will be the neighborhoods that balance emerging social appeal with long-term climate resilience.
The "signs" of a hot market are no longer physical placards on a lawn; they are digital signals buried in gigabytes of data. If you are still waiting for the physical signs, you are already too late. The future of real estate is about listening to what the data is whispering before the rest of the world starts shouting it. Stay updated on these shifts by visiting our helpful guides frequently.